Complete Candlestick Listing
What Is A Candlestick?
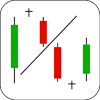
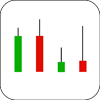
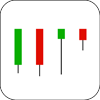
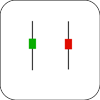
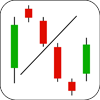
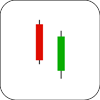
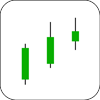
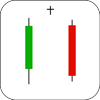
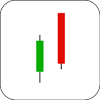
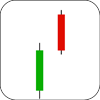
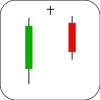
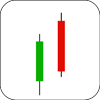
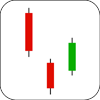
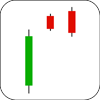
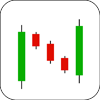
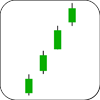
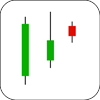
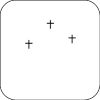
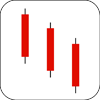
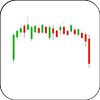
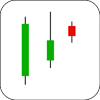
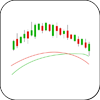
Candlestick charting is a technique imported from Japan. It basically uses a body and wicks or tails to show the price movement for the selected period. If you are completely unfamiliar with candlesticks, check out our intro to candlesticks. Here you'll learn exactly what a candlestick is, how to read charts that use candlesticks, and a little bit about the history of candlestick charting.
If you are already comfortable with candlestick charting, let's move on!
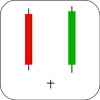
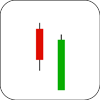
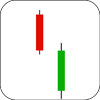
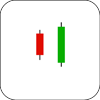
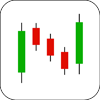
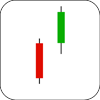
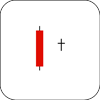
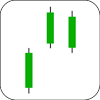
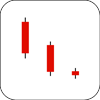
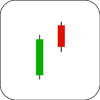
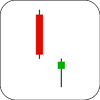
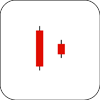
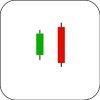
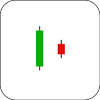
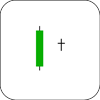
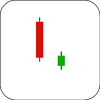
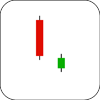
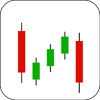
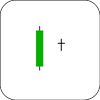
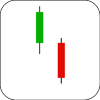
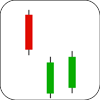
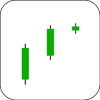
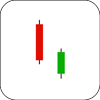
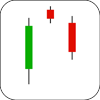
Candlestick Patterns
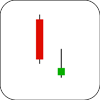
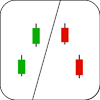
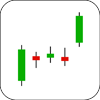
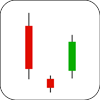
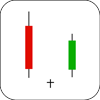
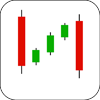
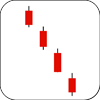
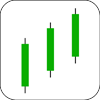
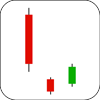
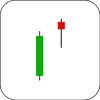
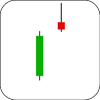
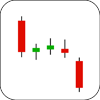
There are many candlestick patterns, each of which are composed of one or more candlestick prints. Each pattern has strict rules which dictate whether or not that pattern is in play. There are both bullish and bearish patterns which can be used with other indicators to create trading signals which determine position entries and exits. The listing which follows is a complete listing of all the various candlestick patterns and definitions, with each pattern being fully discussed on its own page.